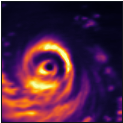
The comparison fleet — which public satellites count against the Tomorrow Constellation
The Tomorrow Constellation — : — public looks—
The record · two Category-5 lives, one clock
The complete watch record of the storm’s whole life, on its own clock.
The record, mapped.
Every microwave look pinned to the storm’s best-track position, and what the sounders actually saw at each category line it crossed. Hover any look on the track to open that pass.
One clock, two readings — top to bottom:
1WHAT WAS THE STORM DOING?Best-track wind, colored by category — dots are real fixes. A pennant marks landfall; the shaded strip is time over land.
2WHO WAS LOOKING?Every look taken — the Tomorrow Constellation in blue, the public fleet’s in gray. The gray band is their longest stretch without one.
TIME · UTC
—
STORM
—
AGE OF PICTURE · PUBLIC SATELLITES ALONE
—
AGE OF PICTURE · WITH TOMORROW.IO
—
The looks themselves.
Channel
What those looks retrieve.
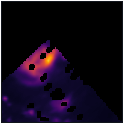
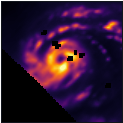
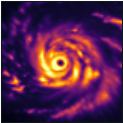
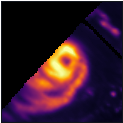
The freshest look at each category line.
The read. Against the six US and European satellites that fly its own instrument, the constellation returned more than twice the looks in both storms — Sinlaku 233:101, Bavi 164:75. But the count swings with scope and isn’t the point. Two things held in both storms, independently: the longest stretch between public-satellite looks fell mid-climb — Sinlaku’s spanning the CAT 3 and CAT 4 lines, Bavi’s at CAT 5 — with Tomorrow.io’s satellites looking through it (10 looks inside one, 10 inside the other); and the combined picture stayed markedly fresher (median gap 33 m vs 49 m alone; 35 m vs 46 m).
The evidence, line by line: at each Saffir–Simpson threshold, the most recent look each side had.
Where Tomorrow.io’s look was the fresher one, it added early warning — the minutes it bought are at right. It doesn’t happen at
every crossing, and both looks are shown regardless.
One constellation, analyzed against the fleet that flies its instrument.
Tomorrow.io’s constellation is analyzed against the following satellites — the operational cross-track microwave sounders of the United States and Europe, the same instrument class TMS flies, each pass independently verifiable against the NASA archive:
What the storm did where it made landfall — reported by top-tier media and science desks.
Sources are limited to established international media and scientific institutions, and every card links to the original. Where a desk filed reporting rather than photography, the card carries the reporting: the only images either outlet published were satellite views of the storm offshore, and this is the part of the record that happened on the ground.
 THE RECORD